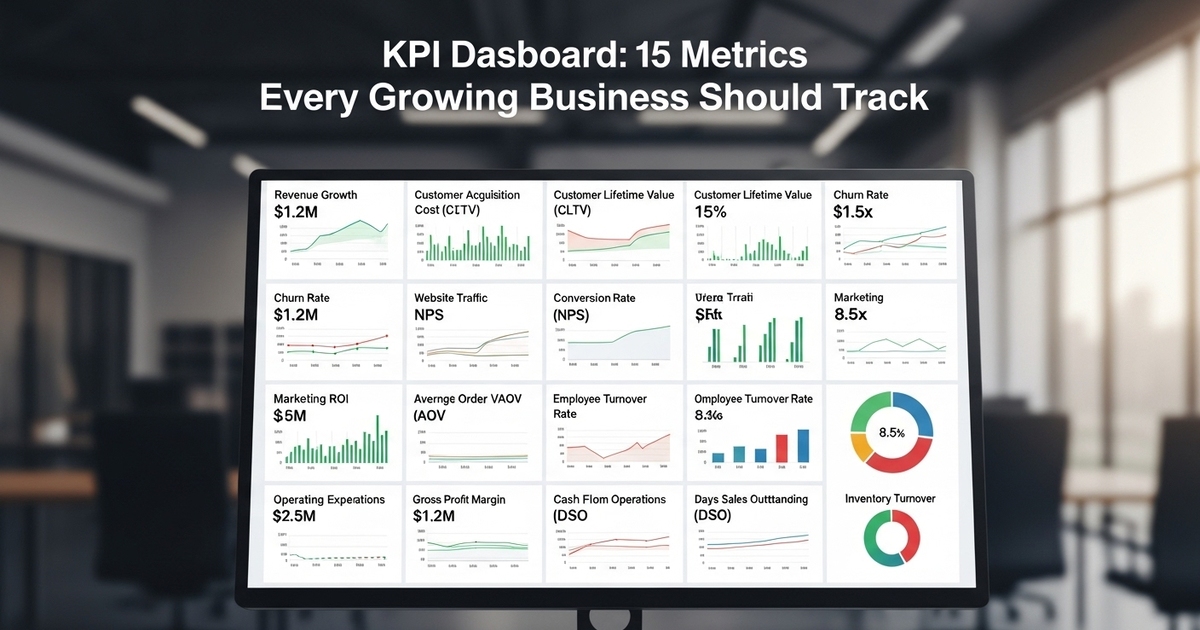
KPI Dashboard: 15 Metrics Every Growing Business Should Track
There is a saying in business that gets thrown around a lot: “What gets measured gets managed.”
It’s a cliché because it’s true. But there is a flip side to that coin that nobody talks about: “What gets measured too much gets ignored.”
We live in the age of data. You can track everything. Website hits, email open rates, average time on page, number of coffee cups consumed by the engineering team. It’s overwhelming.
When I talk to small business owners, their problem usually isn’t a lack of data. It’s drowning in it. They have five different dashboards—Google Analytics, QuickBooks, Stripe, Salesforce—and they are all screaming different numbers.
So, what do they do? They ignore all of them. They go back to managing by gut feel. “Ideally, we’d look at the data,” they say, “but I just need to get this shipment out.”
I get it. But managing by gut feel only works when you are small enough to see everything yourself. Once you start to scale, your gut will lie to you. You need a dashboard. Not a complex NASA-style control center, but a simple, clear view of the pulse of your business.
Let’s cut through the noise. Here are the 15 Metrics (KPIs) that actually matter for a growing business, broken down so you can build a dashboard that gives you answers, not just more questions.
The “Health Check” Metrics (The Vitals)
These are the numbers you check every single week. If these are off, nothing else matters because you might not be in business next month.
1. Cash Flow (Net Cash Position)
Profit is a theory; cash is a fact. You can be “profitable” on paper and still go bankrupt if your cash is tied up in unpaid invoices.
- Why it matters: It tells you how long you can survive. Track your total cash in the bank minus immediate payables. If this number is shrinking, you have a problem. Review our guide on cash flow management to master this.
2. Monthly Recurring Revenue (MRR)
Even if you aren’t a subscription business, try to calculate your “predictable” revenue.
- Why it matters: This is your baseline. It tells you how much money walks in the door before you even get out of bed. Growth comes from increasing this number, not just chasing one-off deals.
3. Burn Rate
How much cash does your business eat every month just to keep the lights on?
- Why it matters: If your revenue stopped tomorrow, how many months could you survive? This is your “runway.” Knowing your burn rate keeps you from making reckless spending decisions.
4. Accounts Receivable (AR) Aging
Who owes you money, and how late are they?
- Why it matters: A sale isn’t a sale until the cash is in the bank. If your “Over 60 Days” column is growing, you are acting as a bank for your customers. Stop it.
5. Gross Profit Margin
(Revenue – Cost of Goods Sold) / Revenue.
- Why it matters: This tells you if your core business model works. If you sell a widget for $100 and it costs $90 to make, you have a 10% margin. That leaves very little room for rent, marketing, or errors. Aim to expand this number constantly.
The “Growth Engine” Metrics (Marketing & Sales)
These metrics tell you if your business is growing or stalling. They measure the efficiency of your funnel.
6. Customer Acquisition Cost (CAC)
How much do you spend on marketing and sales to get one new customer?
- Why it matters: If you spend $500 to get a customer who only spends $400 with you, you are growing yourself into bankruptcy. You need to lower this number or raise your prices.
7. Customer Lifetime Value (LTV)
How much is a customer worth to you over the entire relationship?
- Why it matters: This is the ceiling for your CAC. A healthy business usually has an LTV:CAC ratio of 3:1. If you make $1,500 from a customer, you can afford to spend $500 to get them.
8. Conversion Rate
Of the people who visit your website or walk into your store, what percentage actually buy?
- Why it matters: Increasing traffic is expensive. Increasing conversion is (mostly) free. Improving your conversion rate from 1% to 2% literally doubles your sales without spending a dime more on ads.
9. Lead Velocity Rate
How fast is your pipeline growing month over month?
- Why it matters: Revenue is a lagging indicator (it tells you what happened last month). Lead velocity is a leading indicator (it tells you what will happen next month). If this drops, your revenue will drop in 90 days.
10. Churn Rate
What percentage of customers leave you every month?
- Why it matters: Churn is the silent killer. If you are pouring water (new customers) into a leaky bucket (high churn), you will never fill it up. Fixing churn is often the fastest way to grow revenue. Check out our guide on customer retention for strategies here.
The “People & Productivity” Metrics (Operations)
These metrics are often ignored by small businesses, but they are critical for scaling without chaos.
11. Revenue Per Employee
Total Revenue / Number of Full-Time Employees.
- Why it matters: This is the ultimate efficiency metric. As you hire, this number should ideally go up (because of better systems/software) or at least stay stable. If it drops significantly, you are hiring faster than you are growing, which is bloated.
12. Employee Satisfaction (eNPS)
Employee Net Promoter Score. “On a scale of 0-10, how likely are you to recommend this company as a place to work?”
- Why it matters: Unhappy employees kill growth. They treat customers poorly, and they leave (which costs you money). Track this quarterly to spot culture rot before it spreads.
13. Customer Satisfaction (CSAT or NPS)
Are your customers happy?
- Why it matters: Referrals are the cheapest growth channel. Only happy customers refer. If this score dips, stop selling and start fixing your product or service.
14. Inventory Turnover Ratio
How many times a year do you sell through your entire inventory?
- Why it matters: Inventory is cash sitting on a shelf gathering dust. You want this number to be high. If it’s low, you are buying the wrong stuff or too much of it.
15. Utilization Rate (For Service Businesses)
(Billable Hours) / (Total Available Hours).
- Why it matters: If you sell time (agencies, consultants), you cannot resell an hour that wasn’t billed. If your team is only 50% utilized, you are burning cash. Aim for 75-80%.
How to Build the Dashboard (Without Going Crazy)
You have the list. Now, what do you do with it?
Do NOT try to track all 15 tomorrow.
Start with the “Health Check” metrics. Use a simple tool. You don’t need expensive BI software like Tableau yet. A Google Sheet or Excel file is fine. Or, use a tool like Geckoboard or Databox that plugs into Xero/QuickBooks.
The Golden Rule of Dashboards: A dashboard is useless if you don’t look at it.
- Weekly: Review the 5 Health Metrics. (Cash, MRR, Pipeline).
- Monthly: Review the Growth Metrics. (CAC, LTV, Churn).
- Quarterly: Review the People Metrics. (eNPS, Revenue per Employee).
The Bottom Line
Data isn’t magic. It’s just a flashlight. It shows you where the holes in the floor are so you don’t trip.
Building a KPI dashboard gives you control. It stops the 3 AM panic attacks because you know exactly where the business stands. It allows you to make decisions based on facts, not fear.
So, pick 5 metrics from this list. Set up a spreadsheet. Update it this Friday. It might be the most profitable hour you spend all week.
Need to fix your cash flow metrics? If your cash flow KPI is blinking red, don’t panic. Start by getting organized. Use our 12-month cash flow forecast guide to predict and prevent cash crunches before they happen.